III. Information Aesthetics
III.2 Computer Graphics
The early use of mainframe computers to generate texts (see chap.III.1) provides us with one prehistory of computer graphics (see chap. III.2.2). The other prehistory contains artistic uses of cathode ray oscillographs being applied as control display in electrical engineering and as output medium of analogue computers.
Laposky, Benjamin Francis: Oscillon Number Four, 1950, photo of an oscillograph´s screen.
Since 1950 Benjamin Francis Laposky photographed the screen of his modified oscillograph combined, among others, with a sinus wave generator. The elimited amount of the oscillograph´s wave forms was expanded by Laposky adding "other electrical and electronic circuits...to create the almost infinite variety of forms." Laposky drew a connection between his "electronic abstractions" 1 and computer art:
The relationship of the oscillons to computer art is that the basic waveforms are analogue curves of the type used in analogue computer systems. 2


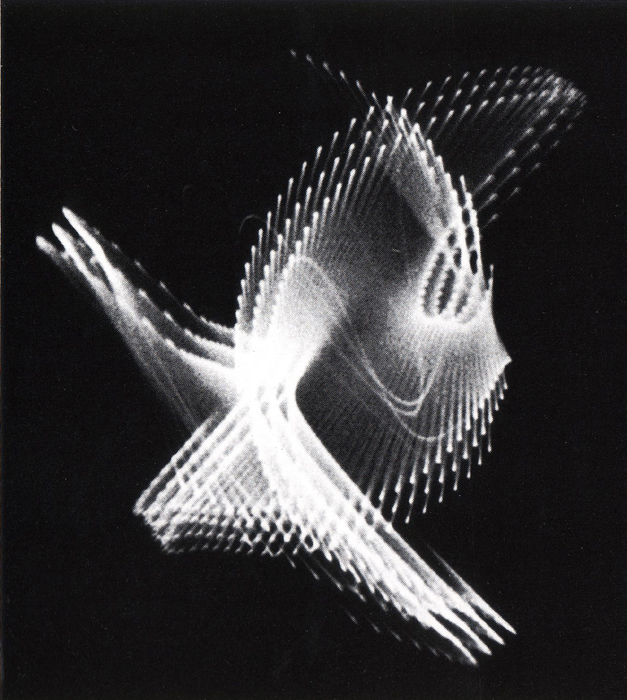
Franke, Herbert W.: Oscillograms, 1956, photos of an oscillograph´s screen.
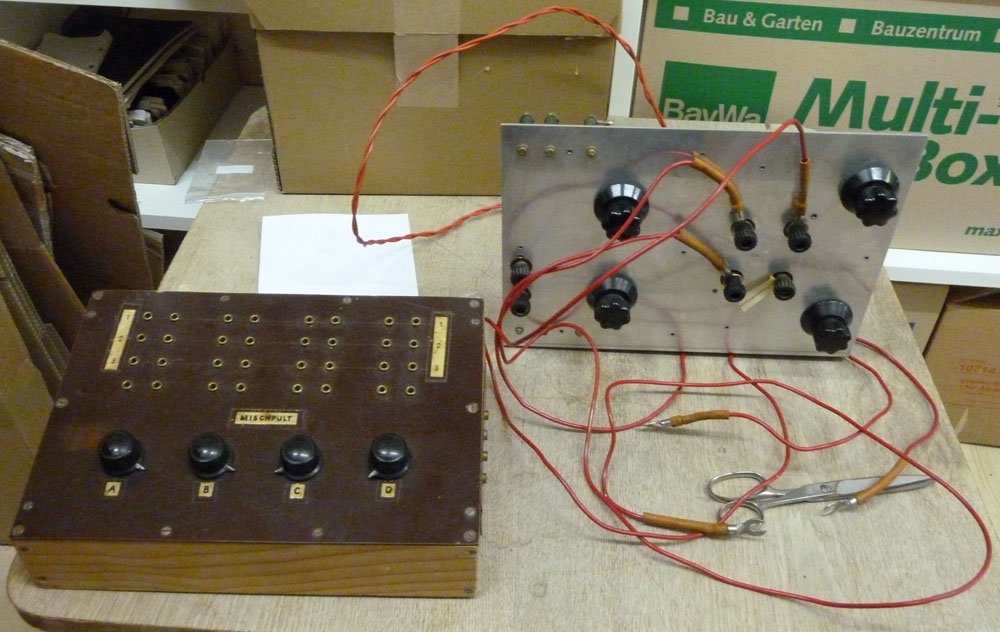
Franke, Herbert W./Raimann, Franz: Analog devices to be connected with an oscilloscope. Photographed in 8/13/2014 in Puppling nearby Egling/Bavaria. Photo: Thomas Dreher.
In 1955/56 Herbert W. Franke produced "pendulum oscillograms" ("Pendeloszillogramme") in moving a Contaflex mirror reflex camera before the screen of an oscillograph presenting curves. For the production of these curves Franz Raimann constructed "an analogue calculation system" for Franke "...being capable to mark out the elementary curves...It was possible to adjust different kinds of overlay [of complicated curves] in real time on a mixing console." 3 With the mixing console modifications of the electron beam´s motion along the horizontal and vertical axes were possible. In oscillosgraphs a horizontal base line motion is usually deviated vertically. Raimann´s analog calculation system offered possibilities to control movements along the horizontal and vertical axis depending on the time dimension.
Franke utilises a calculator constructed for his purposes similar to Schöffer who integrated into "CYSP I" (1956, see chap. II.3.1.2) a little computer built for him by Philips before the production of minicomputers started in the sixties. As Schöffer installed a small computer custom-made by Philips in "CYSP I" (1956, see chap. II.3.1.2) before the minicomputers became available in the sixties, so Franke used a small computer custom-made for his needs. This computer was connected with an oscillograph "producing only thick drawn lines on a screen with a diameter of only 5 centimeters. To be able to receive viable images at all, I experimented with different procedures, but I obtained the best results when I moved the camera with open aperture in a darkened room... before the screen. To obtain a regular movement I mounted the camera at a cord like a pendulum in my first trials but the I finally gained the best results when I moved the camera in my hands continuously – so I trained myself and learned to coordinate the adequate movements. The images show the overlaps of curves as a grid-like structure, often with spatial visual effects." 4 The curves being produced in real time on the oscillograph´s screen were documented by Franke not simply as photographic reproductions, but he obtained structures with visual depth effects in moving the camera with an open aperture. The restrictions for the organization of forms caused by the "thick drawin lines", as they were presented on his oscilloscope´s screen, were transgressed by the artist in moving the camera at varying distances from the screen: Closely following lines and superimpositions became possible.
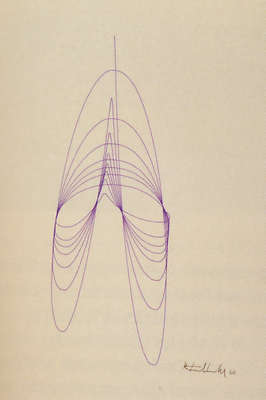
Fuchshuber, Roland K.: Left: Rocker, 1960, plotter
drawing.
Right: Polstelle, 1960, plotter drawing.
In 1960 Roland K. Fuchshuber became a member of the founding commission of the Centre Européen de Traitement de l´Information Scientifique (CETIS). At Euratom (European Atomic Energy Community) in Brussels and Ispra (Italy) Fuchshuber started to produce graphics with PACE analogue computers constructed by Electronic Associates Incorporated (EAI). The "distortion factor of an amplifier" influenced the course of parallel curved lines documented as plotter drawings. 5
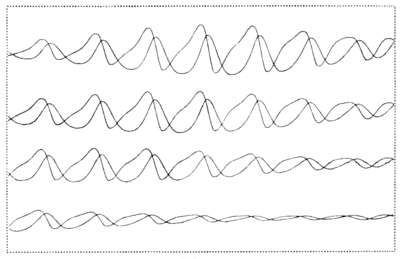
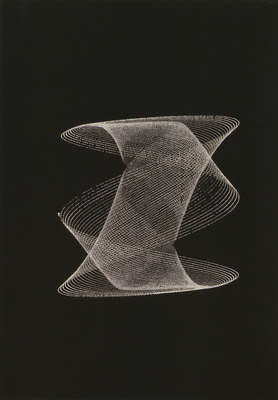
Alsleben, Kurd/Passow, Cord: Computergrafik 4, 1960,
plotter drawing (Alsleben: Redundanz 1962, p.52, ill.d).
In 1960/61 the artist Kurd Alsleben and the pyhsicist Cord Passow used an analogue computer (EAI 231 R) of the Deutsche Elektronen Synchotron (DESY) in Hamburg to produce waves printed in horizontal rows above each other as well as overlapping. Five computer graphics produced as plotter drawings document results of computing processes. One of these prints presents four horizontal rows. Each row is constituted by two overlapping wave lines. "Parameter shifts" determining the course of the wave lines were produced by potentiometers. 6
An analogue computer offered patchboards and potentiometers for manipulations of the computing processes in real time, in contrast to the digital mainframe computers used by Béla Julesz, A. Michael Noll (since 1962), Frieder Nake (since 1963) and Georg Nees (since 1964) allowing only to control the results printed by plotters after the computing processes worked out the instructions (that had to be installed via punchcards or magnetic storage units). FORTRAN or ALGOL, the higher programming languages for compilers, are used for the coding of instructions. Compilers translate programming languages into machine language. Since a few years before the artists mentioned above started to work with digital mainframe computers the first compilers simplified the programming. 7 Before the integration of compilers programming was only possible in machine languages.
In the sixties A. Michael Noll, Georg Nees and Frieder Nake created pioneer works of computer graphics. Their procedures are based on the early computer literature presented in chapter III.1, especially on the works of Christopher Strachey (see chap. III.1.2) and Theo Lutz (see chap. III.1.3):
- a. the selection of a few elements to be stored in a database,
- b. a syntax to combine the elements,
- c. a random generator,
- d. a determination of the frequency defining how often the program can select the elements.
If visual elements are used as basic elements instead of textual signs then the artistic production is transformed to the creation of structures that shouldn´t be neither too simple nor too complex for the visual perception of the whole field as well as for the relations between single elements, as information aesthetics articulated the goal of artistic creation by defining the best relation between order and information for an aesthetic experience. In computer graphics the following modifications of the procedures developed in computer literature can be found:
- ad a. The word database is substituted by elements – mostly lines – constructed by the computing processes executing the instructions of the program (f.e. lines connecting points).
- ad b. The position and the length of basic elements vary with the combinatory manner replacing the textual structure of left to right relations (from word to word) and up-down differentiations (from line to line) by an organisation of the whole plane. The structure of text lines is substituted by a visual arrangement in zones within which the program starts again.
- ad c. Because the random generator has its effects not only in the selection of elements but in the modification of the combinatory method from zone to zone, the spectrum of variations determines the overall view.
- ad d. The limitation of the selection frequency concerns not only the selection of elements but the combinatory method, too, with consequences for the visual effect of the work in its totality, not only for some sentences within an ensemble of sentences. The readability of sentences and/or lines of a text is substituted by the relations between the programmed structure of the plane and the optical effect of the overall view. 8
Before early examples of digital computer graphics fulfilling the criteria mentioned above will be explained a short ouline of the goals of information aesthetics is presented because they influenced especially Georg Nees and Frieder Nake.
A core subject of information aesthetics are the relations between the structure of a program and the visual perception of its presentation. Max Bense and Abraham Moles define the "aesthetic measure" by exploring the best possible relation between the "complexity" of the visual "information" and the "orderliness" ("redundancy") that can be recognized in the process of perceiving the work: Bense determines the aesthetic measure in using George David Birkhoff´s definition as `order divided by complexity´ ("Birkhoff´s quotient"). 9 In contrary Moles refers to empirical investigations in his argument for the `multiplication order by complexity´. 10
Shannon´s "statistic information" provides the basis for this numerical definition of the "aesthetic measure". 11 It presupposes precise knowledge of the number of used elements ("sign repertoire") and the possibilities to combine them. 12 That´s why concrete-serial and programmed art offer model cases for information aesthetics.
Following Bense in art improbable orders are realised by the "elimination of the avoidable" and the "reduction of redundancy". 13 Meanwhile Bense discusses characteristics of art works, Moles thematises their perception. In Moles´ reflections the receiver´s "limit of apperception" and its dependency on the observer´s previous knowledge are dominant subjects. If the visual complexity is above the "limit of apperception" then there is no order recognizable. That´s why this limit should not be transgressed. 14 Thus, a certain amount of redundancy is inevitable. Contrary to John Cage´s non-normative aesthetics of simultaneous chance operations 15 the information theory explicates an objectifiable aesthetic goal: For aesthetic factors it defines the best relation between information and redundancy.

Götz, Karl Otto: Statistic-metric Trial 4:2:2:1, concept Summer 1959, realisation with pencil and felt pen on cardboard 1960. Photo: Kukulies. Collection Etzold. Städtisches Museum Abteiberg. Mönchengladbach (Kersting: Sammlung Etzold 1986, p.206).
In the fifties Karl Otto Götz became known as an informal painter and as a member of the artists´ group Quadriga. From 1959 to 1961 Goetz experimented in "statistic-metric modulations" with grids filled with black and white rectangles. These "modulations" were still carried out manually.
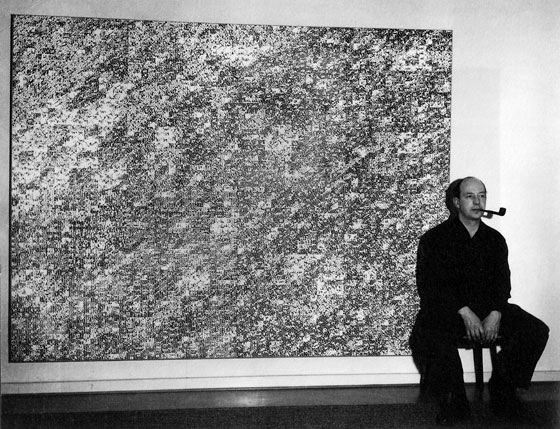
Karl Otto Götz before Density 10:3:2:1, 1961, felt pen and tusche on Bristol cardboards, mounted on canvas (Götz: Erinnerungen 1983, p.900, ill.1016).
In "Density 10:3:2:1" (1961) Götz divides the "image area (200 x 260 cm)" in "16 super zones" and subdivides them in "16 big zones" of equal size. He determines the frequency of the black rectangles (in relation to the "2 brightness degrees" black and white) in the four "density degrees" indicated by the title. The basic unit is a grid with four by four rectangles (16 big zones", each with 16 "little zones"). One of these 16 rectangles is white (density degree "very bright") and 10 rectangles are black (density degree "dark"). In relation to the density degrees between black and white rectangles are 2 rectangles brighter ("lower density") and 3 rectangles darker ("middle density"). The title "Density 10:3:2:1" designates 10 times the density degree "dark", 3 times "middle density", two times "lower density" and one times the density degree "very bright".
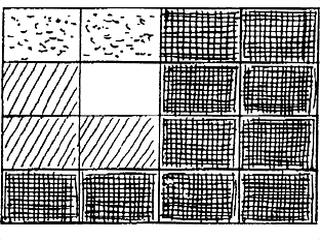
Götz, Karl Otto: Density 10:3:2:1, sketch, 1961, division of the image´s surface in super zones with four density degrees (Götz: Malerei 1961, p.14).
Götz visualises the realisation of the four density degrees with a grid of 2 by 3 squares: From these six squares with increasing density no field ("very bright"), one field ("low density"), three ("middle density") and five fields ("dark") are filled with black colour. The brighter or darker appearances of the grids are a result of a number of black or white elements being distributed randomly: "statistic relations between quantities".
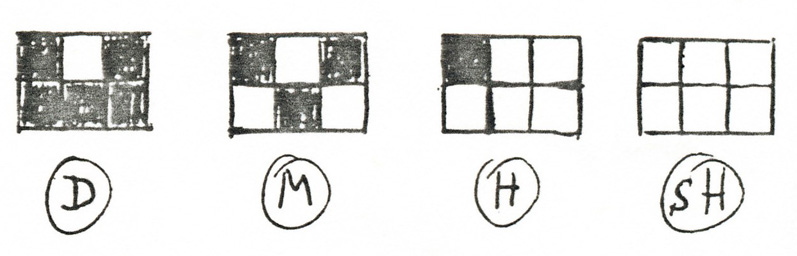
Götz, Karl Otto: Density 10:3:2:1, sketch, 1961, little zones with four denstiy degrees: D = dark, M = middle density, H = low density, sH = very bright (Götz: Malerei 1961, p.23).
The 16 x 16 (=256) big zones distributed on 16 super zones constitute a plane provoking the eye to slide between the zones with different amounts of black and white elements, and to look for visual cues at prominent, particularly dense black or white fields. The partition in "big zones" is recognizable at horizontal and vertical break lines between zones with dominant black squares on one side and dominant white squares on the other side.
Students work out at home their area on "pre-rasterised drawing cardboards" with felt pen and tusche. Then the grid image was "put together by mounting the cardboards" prepared in labor division "on canvas". The realised "ca. 400.000 image points (elements)" constitute a "model image" that could be realised as an "electronic television image". The two "brightness degrees" of Götz´s "model images" could be substituted by the "ca. 40 brightness degrees" of the television image with "450.000 image points".
In 1960 Götz tried to persuade Siemens to realise his "grid images" but failed. In 1962 the film "Density 10:2:2:1" (8 mm) was produced by combining photographed permutations of parts of the "grid image" as shots. Intertitles indicate which grid elements – "basic units in little zones", "little zones", "big zones" – have been replaced from shot to shot. Götz photographed these permutations. The photographs constitute the shots of the film. The sequences of shots presenting the raster permutations are brought into motion by the projection of the film and provoke the impression of a flickering image. The permutations proceed from the smallest "units" to the "big zones", and the changes become recognisable in the course of seeing longer phases of the nearly three minutes lasting film.
Götz, Karl Otto: Density
10:2:2:1, 1962, film (8 mm) in Vimeo, Screenshot
(Claus: Zeitalter 2008).
Götz calculated the "information content" ("Informationsgehalt") of his images. Concerning the observers´ problems to recognize order in the connections between the rectangles of the "statistic-metric modulation" it is no surprise that a high "total information content" ("Gesamtinformationsgehalt") and few "redundancy" have been the result of his calculations. Götz pursued "information theoretical observation" and investigations of "gestalt psychological values" as separate fields of study. 16
Götz anticipates algorithms of digital computer graphics in a still manual realisation: The reduction of the realisation process to a few elements, the combination rules and the selection possibilities limited by rules based on criteria of frequency are aspects of information aesthetics that recur in later computer graphics.
In 1956 the electronics engineer Béla Julesz obtained a doctorate from the Hungarian Academy of Sciences. After the army of Soviet Union invaded Hungary, Julesz emigrated to the U.S.A. Several weeks after his arrival the Bell Laboratories in Murray Hill/New Jersey affiliated Julesz to their technical research team. 17
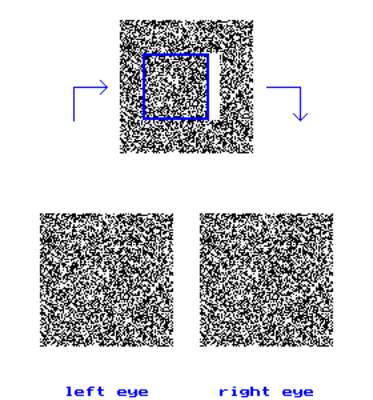
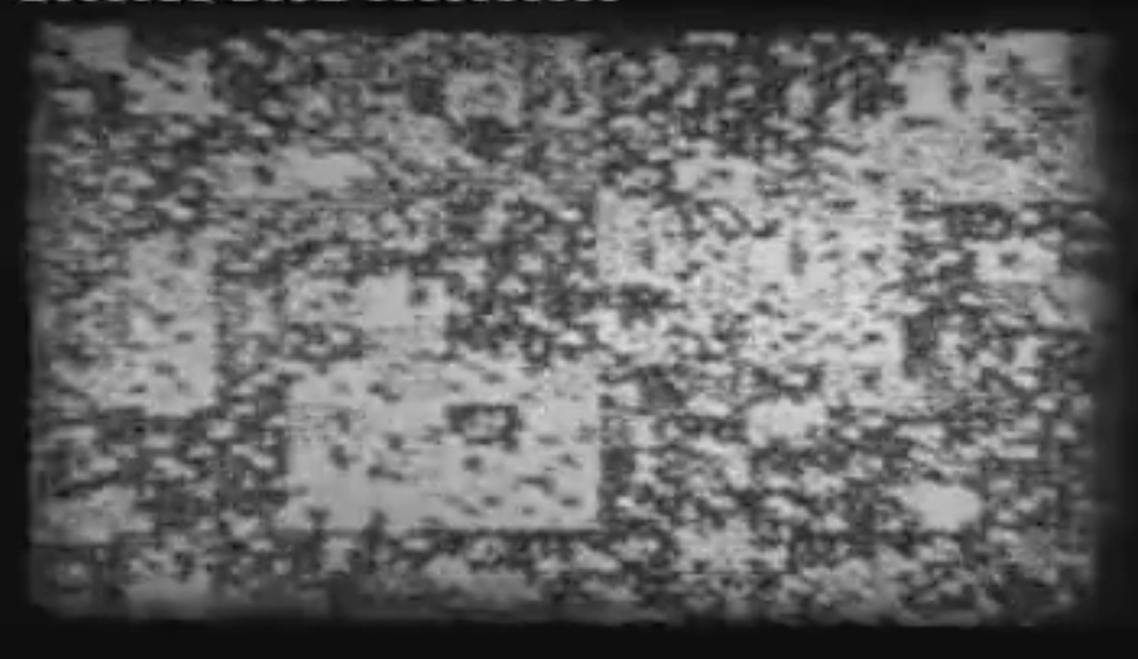
Julesz, Béla: Stereopsis, 1959, plotter drawing.
In 1960 Julesz published his investigations of the "Binocular Depth Perception of Computer-Generated Patterns" in "The Bell System Technical Journal". This issue of the "Technical Journal" contained glasses to observe the random dot stereograms illustrating Julesz´s contribution: These glasses anticipate LCD shutter glasses. 18 Pro stereogram a mainframe computer IBM 704 (1954-60) calculated images with 10.000 points. A pseudo-random generator distributed 16 brightness degrees. 19 The rectangles, printed and published beside each other, had the same random distribution of points except specific divergences in their middle zones: Within each of the rectangles an identical square field was displaced to the left and to the right ("parallax shift"). The deviations concern a displaced square zone and its environments. 20 This "parallax shift" provoked in the binocular perception with glasses a three-dimensional effect, nevertheless no features of the images suggest a resolution by visual patterns for three-dimensional objects.
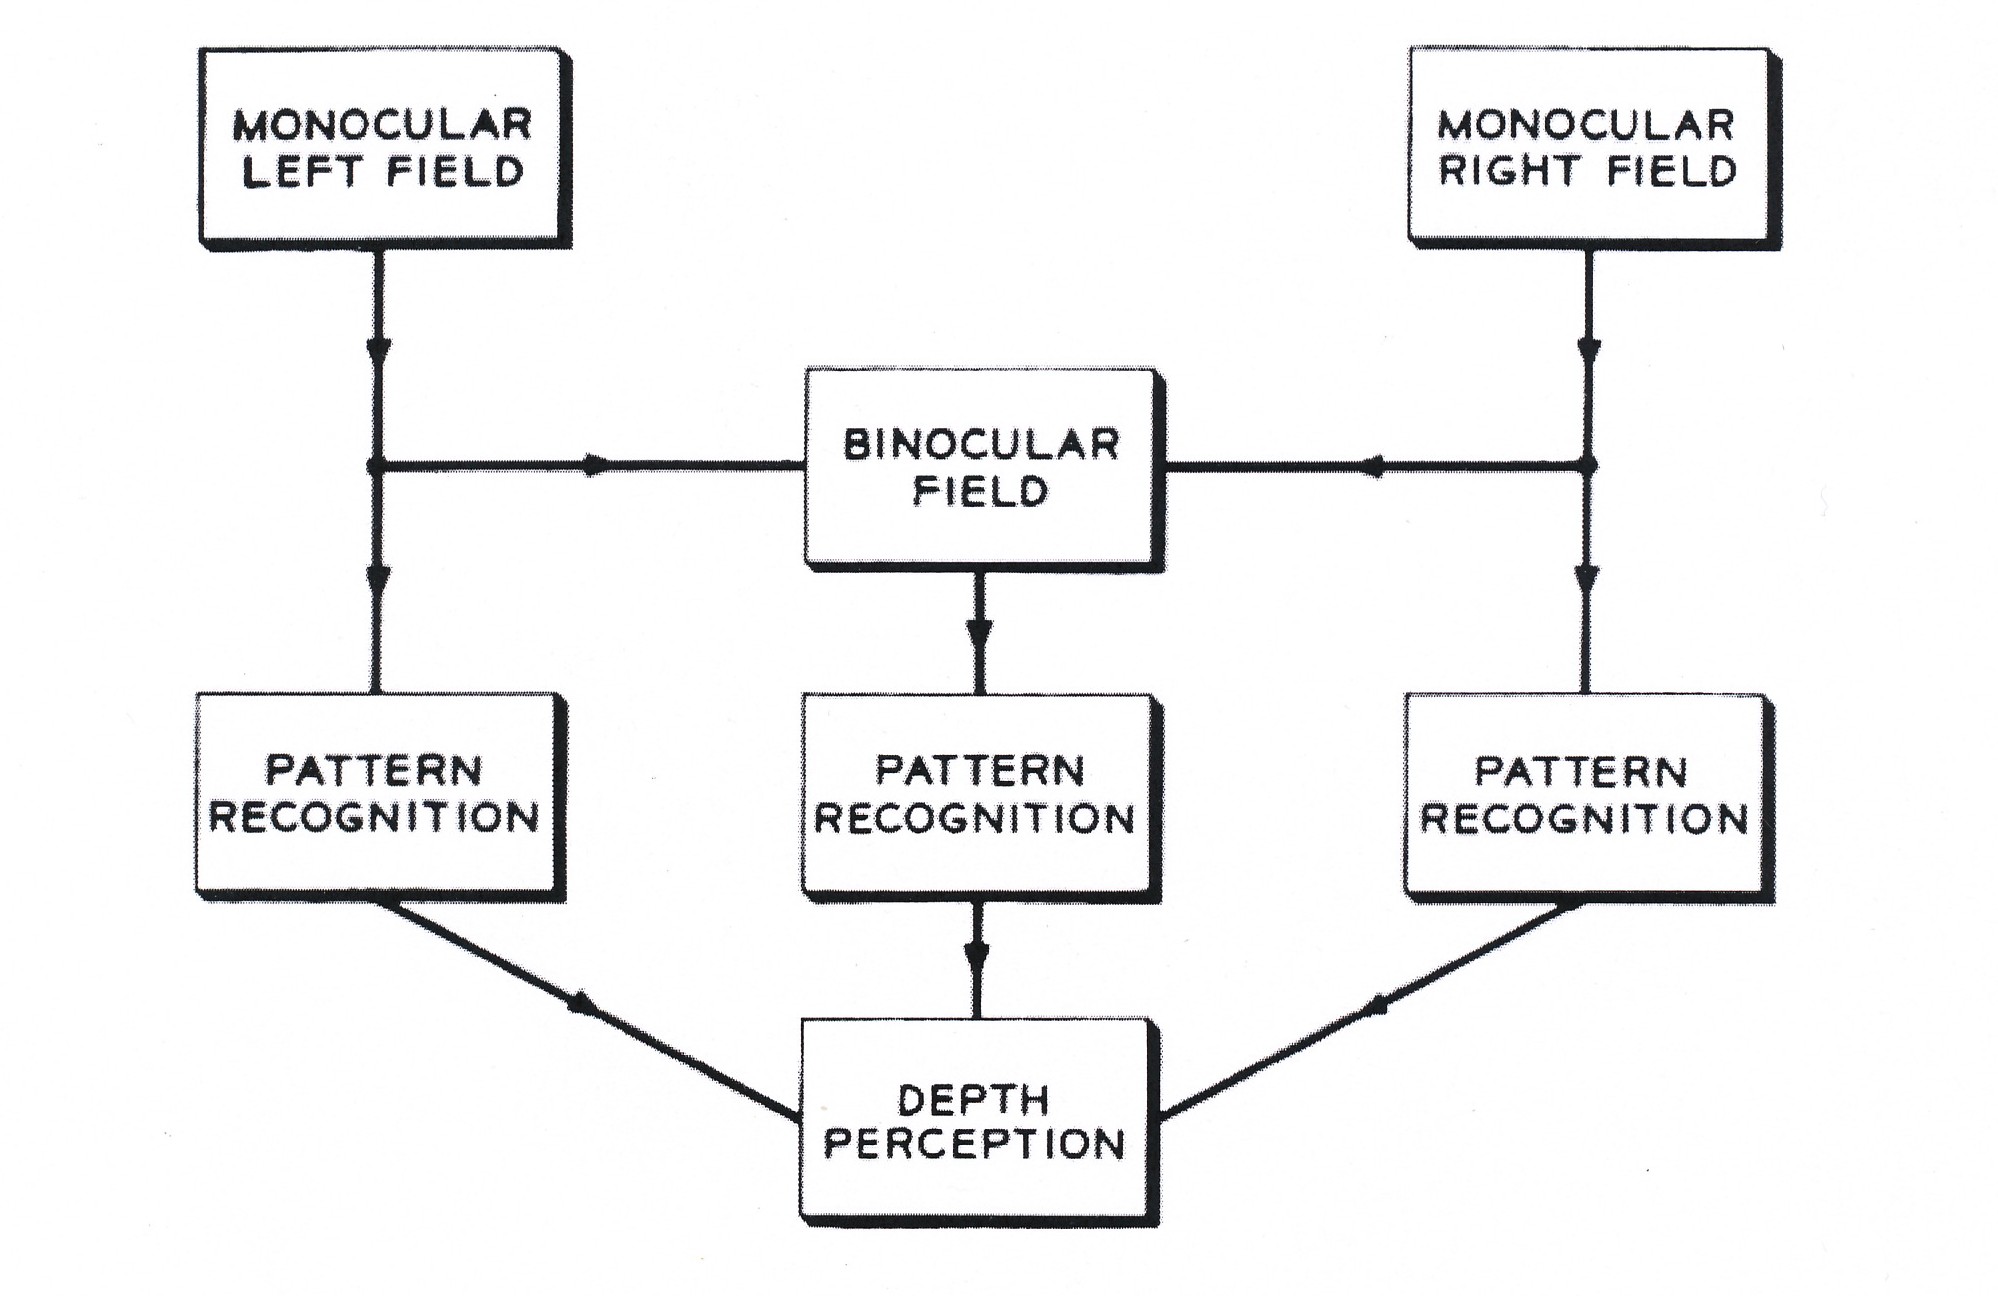
Julesz, Béla: Depth perception by monocular and binocular pattern recognition, 1960 (Julesz: Depth Perception 1960, p.1128, fig.3).
Julesz identifies a genuine "binocular pattern recognition" without presupposing a "monocultural pattern recognition": The binocular pattern recognition follows its own rules. 21 Depth perception can arise not only on the basis of "binocular pattern recognition" but as a "combination of binocular and monocular pattern recognition", too: "Monocular macropattern recognition" intensifies the depth effect. 22 Julesz´ investigations of the "cyclopic perception" demonstrate that the depth perception combines visual patterns recognizable with one eye and binocular visual patterns. Julesz´s investigations had consequences for the perceptual psychology, the cognition research and the development of autostereograms with only one image. 23 In 1965 Julesz´s perceptual experiments were exhibited together with A. Michael Noll´s computer graphics in the Howard Wise Gallery in New York. 24
In 1961 A. Michael Noll completed his studies at the Newark College of Engineering with the B.S.E.E. (Bachelor of Science in Electrical Engineering). From 1961 to 1971 he worked in a department for telephone transmissions at the Bell Laboratories (Murray Hill/New Jersey). 25
In Summer 1962 Noll programmed "Patterns" in FORTRAN and produced them with an IBM 7090 (since 1959) of the Bell Labs. Noll didn´t want that they may be understood as "`true art´". 26 A Stromberg Carlson 4020 Microfilm-Plotter presented the results of the computing processes on a cathode ray tube as configurations of electrons. The computing processes lead to the production of images on the screen via a "Decoder and Command Generator". Noll´s FORTRAN code included instructions for the microfilm plotter to start further "subroutines". The resulting image on the screen was photographed and the 35mm negative was "multiplied by photo printing in different sizes." 27
The computer was instructed to produce lines as connections between points located by a "White Noise Generator". A combination of lines in different length constituted a jagged line.
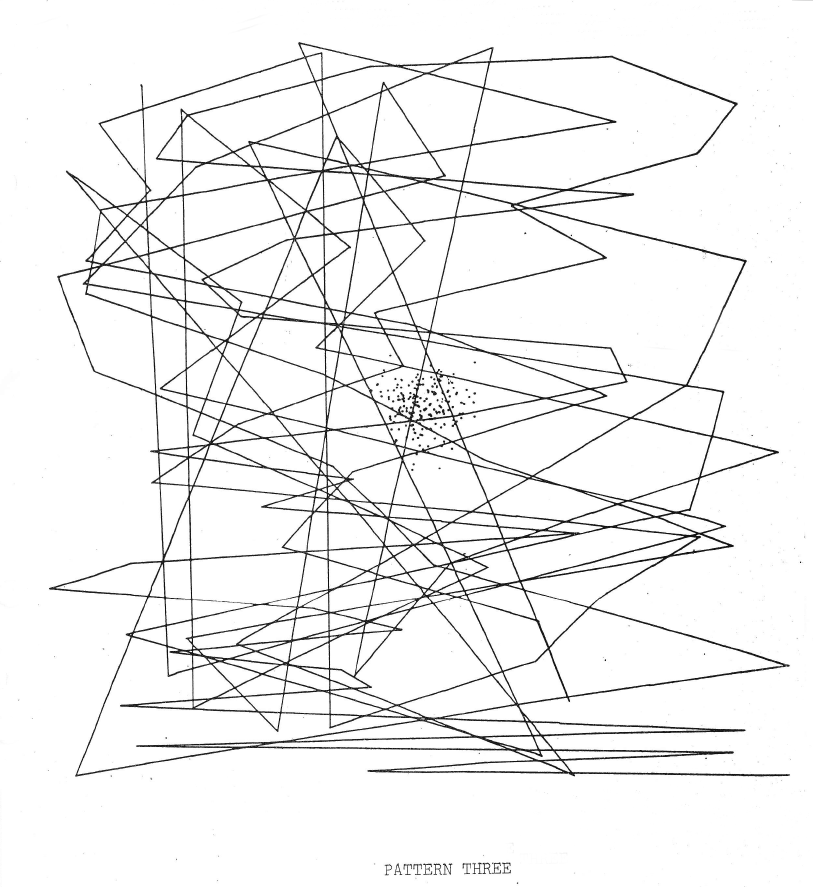
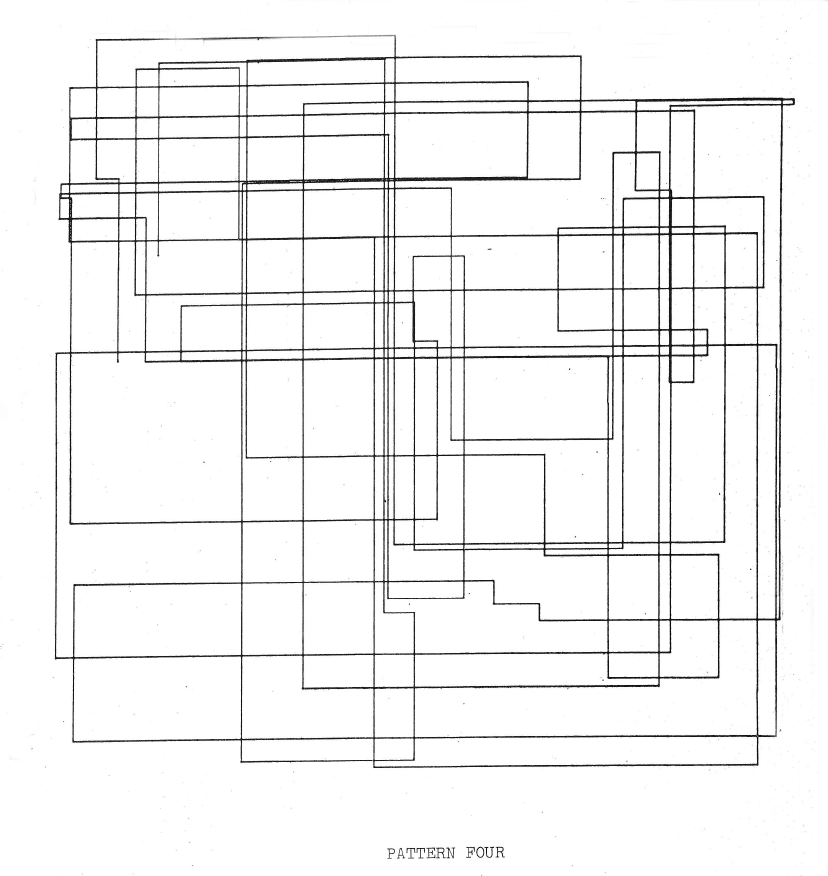
Noll, A. Michael: Left: Pattern Three, 1962, photo
print.
Right: Pattern Four, 1962, photo print (Noll: Patterns 1962, unpaginated).
Noll programmed the point clouds on the jagged lines in "Pattern One", "Two" and "Three" around a central point. In "Pattern Four" and "Pattern Five" points with values calculated by random procedures for x- and y-axes served for the localisation of lines: These points are "alternately repeated to make the lines horizontal und vertical." The line connecting all points changes its direction exclusively at right angles. In "Pattern Four" are both ends of the line recognizable within fields marked by this line. 28
In "Gaussian Quadratic" (1962/63) Noll distributes 100 points on the horizontal and vertical axis following different criteria: The localisation in the horizontal axis follows the Normal- or Gaussian distribution, meanwhile the vertical localisation is calculated based on an equation:
The vertical position increase quadratically, i.e., the first point has a vertical position from the bottom of the picture given by 12 + 5x1, the second point 22 + 5x2, the third point 32 + 5x3, etc. 29
To avoid points located outside the determined size of the work´s area the distribution on the vertical axe at the top edge of the frame was mirrored at the bottom. The Gaussian distribution on the horizontal axis follows the standard normal distribution. The connections of the points constitute 99 lines crossing each other several times in a vertical midfield. These lines form a jagged line with accidental direction changes and some remarkable deflections on the horizontal axis. The jagged line appears as a vertical formation that balances on the lowest horizontal line serving as a base.
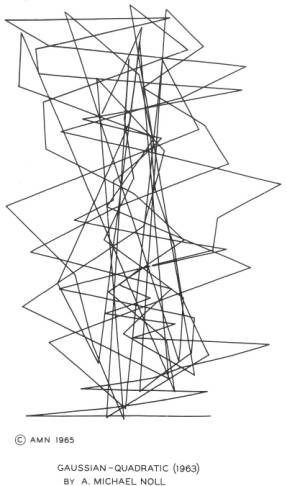
Noll, A. Michael: Gaussian Quadratic, 1962/63, photo print.
In "Gaussian Quadratic" Noll follows the strategy of a line´s accidental direction changes that he used in many other of his "Patterns", too. He expands the algorithmic criteria in "Gaussian Quadratic" in a way that the relations between order and chance in its configuration of lines provoke a perception searching for the "aesthetic measure" more than the "Patterns". 30
The "patterns" realised by Noll in 1962 are designated by Frieder Nake as "polygon moves" ("Polygonzüge"). 31 In December 1964 "polygon moves" programmed by Georg Nees were published in issue 3/4 of the "Grundlagenstudien aus Kybernetik und Geisteswissenschaft" ("Basic Studies in Cybernetics and Humanities"). 32 The instructions written in ALGOL ran on a mainframe computer Siemens 2002 (1959-66). A Zuse Z64 Graphomat printed the results.
Nees, Georg: 23-Ecke, 1964, plotter drawing
(Nees: Grundlagenstudien 1964, p.124, ill. 2).
The polygon moves occur several times next to each other and one below the other. The algorithm starts anew in fields respectively "matrices" 33 and determines via random generator the distribution of consecutive lines. The number of lines is defined by the program.
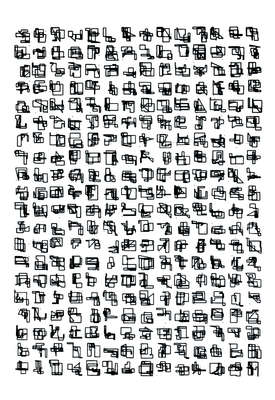
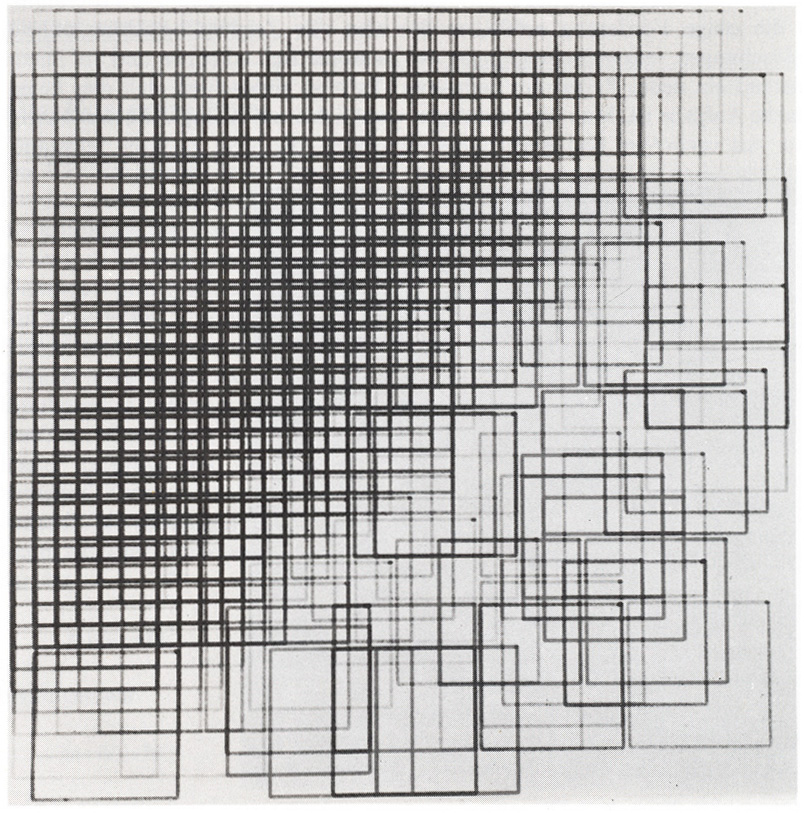
Nees, Georg: Untitled (Micro Innovation), 1967, plotter drawing (Nees: Computergraphik 2006, p.222, ill. 31).
In a series of computer graphics realised between 1965 and 1968 Nees defines how far the "polygon moves" can transgress the fields within which the program restarts the configuration of lines. 34 Because the distances between the "matrices" are short the transgressing polygon moves interpenetrate each other. At a quick glance they appear as a complex snarl of lines. 35 The structure of a snarl with lines crossing each other tilted and rectangular can be recognised only by a closer examination at a short distance, in a reconstruction of the relations between the line configurations. In a total view zones of denser superimpositions and dominating directions of lines across several zones attract the attention.
In Nees´ works the observation of relations oscillates from work to work in different manners between a complexity by plurality (via the division in "matrices" and the superimpositions of line configurations) and a simplicity provoked by the structuring process of the perception for the whole field. 36 The graphics of Georg Nees can be seen as models for an investigation of the problem how "order and complexity" 37 can be mediated to obtain a better "aesthetic measure".
Looking for similarities and repetitions to simplify the formation of visual schemata – in terms of information theory: to enable the recognition of order via redundancy (as a return of the same) – observers refocus a print´s surface several times. Nees calls this process a "gradation of the type heap-variation-gestalt" ("Gradation vom Typus Haufen–Variation–Gestalt"). 38 The "micro-aesthetics" of the produced object – determined by the "creation of texture by overlapping" 39 – and the "macro-aesthetics" – as a cognitive restructuring by the use of schemata in the process of seeing – constitute inter-related levels: "Gestalts are aesthetic information units with a local and distal nexus." ("Gestalten sind ästhetische Informationseinheiten mit Lokal- und Distalnexus.") 40
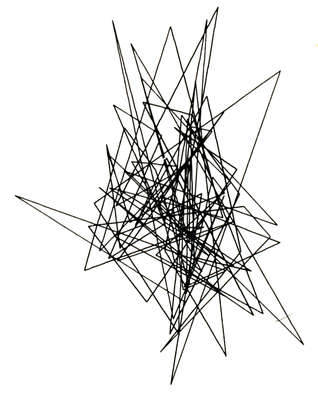
Nake, Frieder: Random Polygon Move, 1963, plotter drawing, 10 x 10 cm (Nake: Ästhetik 1974, p.19, ill.5.2-7)/1964, plotter drawing, 15,5 x 11,5 cm (Herzogenrath/Nierhoff-Wielk: Machina 2007, p.424, nr.259).
Since 1963/64 Frieder Nake developed the translation program Compart ER 56 in the machine language to control via the mainframe computer Standard Electric Lorenz (SEL) ER 65 (since 1959) the drawing board Zuse Z64 Graphomat bought by the Computer Centre Stuttgart shortly before. In 1963 Nake used his program to create "random polygon moves" with lines connecting points located by a "pseudo random generator". Nake realised his works after Noll´s "polygon moves" and evidently before Nees´ works with such combinations of lines. 41
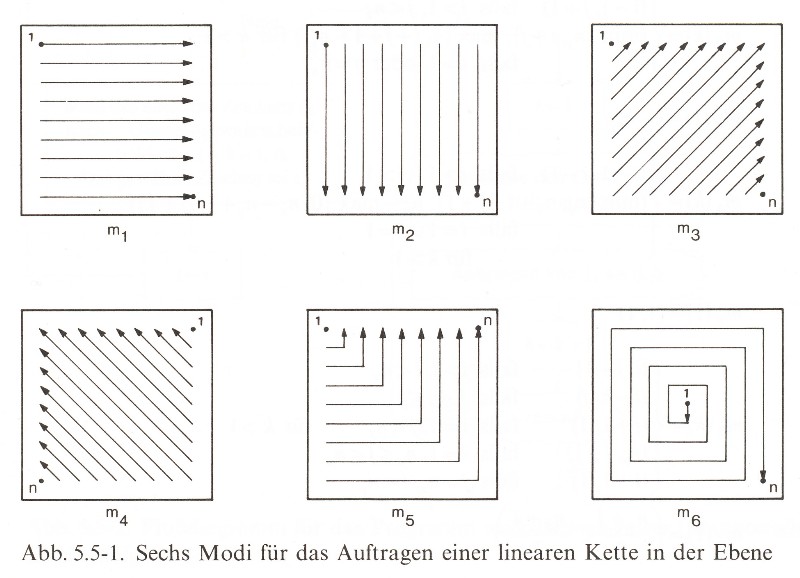
Nake, Frieder: Walk-Through-Rasters, 1966, six modes (Nake: Ästhetik 1974, p.229, ill. 5.5-1).
In 1966 Nake developed the program "walk-through-raster" in "ALGOL60 (with some assembler-sub-programs)". A punch tape contained the instructions for a Telefunken TR4 (since 1962) of the Stuttgart University. The results were printed by a Zuse Z64 Graphomat.
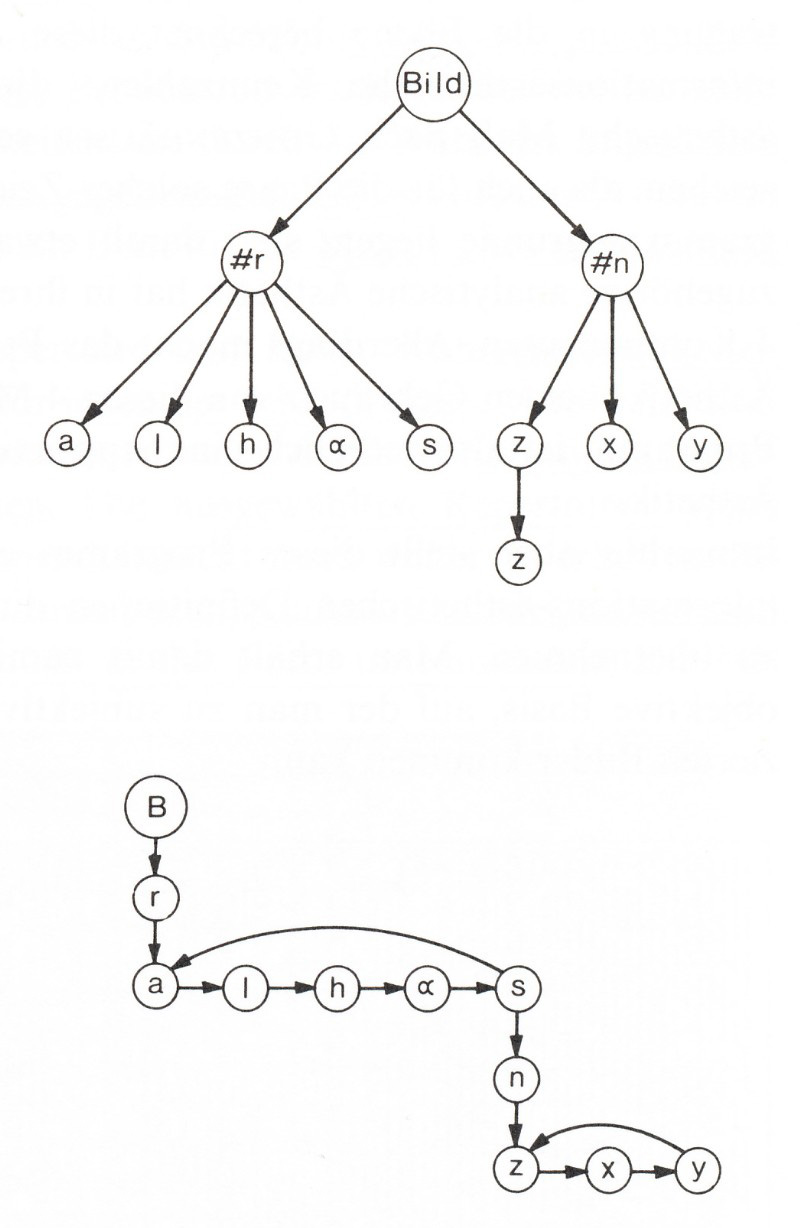
Nake, Frieder: Walk-Through-Raster, 1966, diagram of
the tree structure
(Nake: Ästhetik 1974, p.235, ill. 5.5-4).
The program selected signs from a repertoire depending on "the last chosen sign". As explained by Nake, the program simulated a "short memory". 42 The program exchanged the signs at specified positions. The exchange is determined by programmed "transition probabilities" ("Übergangswahrscheinlichkeiten"). 43 The program stepped in one of "six modes" 44 through a field divided in rectangles and decided where which kind of transition will be computed. The decision procedures can be illustrated as tree structures unfolding themselves in the horizontal axis as well as in the "depth". 45
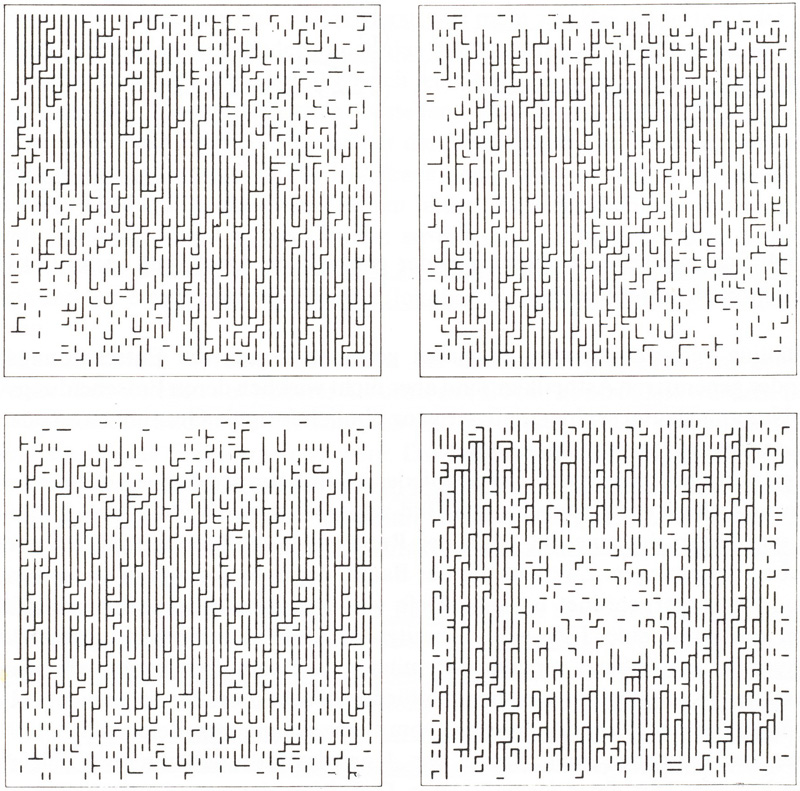
Nake, Frieder: Walk-Through-Raster, series 2.1, four realisations, 1966, plotter drawings (Nake: Ästhetik 1974, p.236, ill. 5.5-5).
The sign repertoire of the series "2.1" is constituted by vertical and horizontal lines as well as by a blank field. For the "6 modes" of the directions in which the computing process runs step by step across the plane six variants with "defined repertoire and defined probabilities" were created. 46 For the series "7.3" squares marked by lines in different colours were selected. The squares were "remarkably larger than the fields of the grid". The squares´ overlaps constitute configurations described by Nake as a "destruction of the basic repertoire" ("Zerstörung des Elementarrepertoires"). 47 Nake refered in his description to Nee´s explanation of the "destruction of the matrices´ arrangement" ("Zerstörung der Matrizenanordnung"). 48
Nake, Frieder: Walk-Through-Raster, series 7.1, 1966, plotter drawing in four colours (Nake: Ästhetik 1974, p.237, ill. 5.5-6).
The "walk-through-raster" program was able to execute "a series of measurements following criteria of information aesthetics" like "redundancy and information values as well as distinguishing features and the surprise measure of each sign" ("Redundanz und Informationsgehalt sowie Auffälligkeit und Überraschungsmaß jedes Zeichens"). 49 To be able to integrate the measurements as a "selector" ("Selektor") of the generated signs into the computing process, Nake installed in his program "Generative Aesthetics I" a "preselector" ("Vorselektor") with statistic measures for the frequency of colours. The "statistic preselector" could not differentiate between pictures with the same frequency of colours. 50 The "topological selector´s" ("topologischer Selektor") programming of the colour distribution on the plane used a frequencies´ measure, and it was based on the raster principle:
A probability distribution p=(p1,..., pr) for r colours has to be determined for each image. These colours should be distributed on the plane of the image. For the realisation of this goal the plane will be divided in 4 equal rectangles and the whole "mass" of each colour will be distributed on these 4 rectangles. The process will be repeated for each of the rectangles etc., until a lowest level that can´t obviously be deeper than the level of the raster fields, but usually the goal will be realised earlier. 51
The "generator" combines the statistical and topological preselection in procedures following each other comparable to Marcow chains. The output of a line printer presents the notations. The notation´s signs contain the information, how little rectangular leaflets in four colours should be distributed on the plane. In 1969 two examples were realised on hardboards. 52
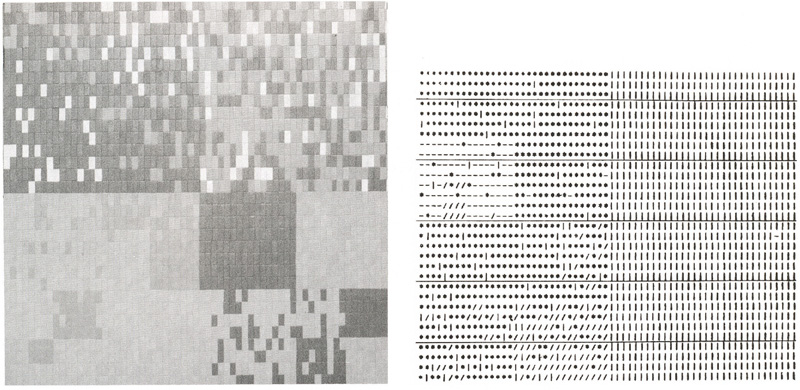
Nake, Frieder: Generative Aesthetics I, 1969. Left: Experiment 6.22, coloured leaflets on hardboard. Right: print of a result of the programmed computing process, Experiment 4.5a (Nake: Vergnügen 2004, unpaginated).
In "Generative Aesthetics I" Nake realised an integration of frequency criteria into the computing processes going further than earlier computer graphics. In the book "Ästhetik der Informationsverarbeitung" ("Aesthetics of Information Processing") Nake explains how to investigate relations between the preselection and a selection following information theoretical criteria of the "aesthetic measure":
Comparable to a physicist´s method to formulate propositions on nature by controlled models in the laboratory, an aesthetician is imaginable preparing and examining statements on `art´ via controlled models in a laboratory (that still has to be constructed). 53
In reply to Bense´s "Generative Aesthetics" 54 investigating the properties of realised works, Nake plans to offer a programming making an "aesthetic description before the [experience of a realised work as an] aesthetic reality is possible." 55
Information aesthetics inspired the development of strategies to develop procedures of programming as a precondition for the production of art. The problem of the "aesthetic measure" has not lost its actuality: It reappears in the recourse of contemporary Generative Art on cybernetic relations between chaos and order, as in 2003 Philip Galanter explained it in his lecture "What is Generative Art? Complexity Theory as a Context for Art Theory". 56
Annotations
1 Laposky: Oscillons 1953, p.2. back
2 Laposky: Oscillons 1976. back
3 Franke/Nierhoff-Wielk: Ästhetik 2007, p.110 (quote); Herzogenrath/Nierhoff-Wielk: Machina 2007, p.336,338, Nr.68s.; Piehler: Anfänge 2002, p.149-152, unpaginated with ill.29s . back
4 Herbert W. Franke, e-Mail, 8/17/2015. There Franke wrote about "the standard setting of an oscillograph": "With this setting the electron beam moves back and forth on a base line...the beam goes slowly (traceable with the eyes) from the left to the right side and it jumps then back to the left side again. A horizontal line at the bottom would arise. But the line is distorted by impulses of the measuring process pointing to the y-[vertical] axis: The result is an 'image' of the alternating current´s course. If one modifies experimentally the settings, then this will cause 'arbitrary' other images...I needed the analog computer to produce curves z(x,y). The value z stands for the luminance of the image on the screen. x and y are the coordinates [of the horizontal and vertical axes] of an image point leaving behind traces of light on the screen. The curve is produced as follows: The analog computer processes two functions f1x(t) and f2y(t) depending on the time t physically as two independent oscillations (by determining the forms with its frequencies and being tunable as well as modifiable in real time)." back
5 Herzogenrath/Nierhoff-Wielk: Machina 2007, p.150,232,362s., nr.150s.; Nierhoff-Wielk: Machina 2007, p.28s. back
6 Untitled, 1960, plotter drawing. In: Alsleben: Redundanz
1962, p.52. with ill. d; Piehler: Anfänge 2000, p.204s., unpaginated
with ill.33; Rosen: Story 2008/2011, p.248.
On plotter drawings by Alsleben and Passow: Alsleben: Redundanz 1962,
p.51s.; Alsleben/Eske/Idensen: Aestheticus 2011, p.149ss.; Herzogenrath/Nierhoff-Wielk:
Machina 2007, p.65,234,297s.; Nierhoff-Wielk: Machina 2007. p.27s.; Piehler:
Anfänge 2000, p.203ss., unpaginated with ill. 33s.; Reichhardt: Serendipity
1968, p.94; Weiß: Netzkunst 2009, p.326ss. back
7 IBM delivered the first FORTRAN compiler since April
1957 (Without author: User Notes 1996-98). The Electrologica X1 compiler
(August 1960) by Edsger Wybe Dijkstra and Jaap A. Zonneveld is deemed
to be the first compiler for ALGOL60 (Daylight: Dijkstra 2010).
On plotters: Piehler: Anfänge 2000, p.177-180. back
8 In Gerhard Stickel´s "Autopoems" from 1965 the syntactical structures are selected by a random generator, too (see chap. III.1.3), but the frequency of the access to each one of the structures is not limited – contrary to Lutz´s "stochastic texts". back
9 Bense: Aesthetica 1982, p.33s.,322s.,328s.,354f.; Bense: Einführung 1965/1968, p.30-35; Bense: Einführung 1969, p.43ss.,55s.; Bense: Informationstheorie 1963/2000, p.136; Birkhoff: Measure 1933. back
10 Moles: Information 1965/1968, p.23; Moles: Art 1971, p.24ss. back
11 Bense: Aesthetica 1982, p.212,325; Bense: Einführung 1965/1968, p.34; Shannon: Communication 1949, p.16. back
12 On the "aesthetic measure" discussed by Birkhoff, Bense, Moles et al.: Nake: Ästhetik 1974, p.75ss,82ss. back
13 Bense: Aesthetica 1982, p.147,211,214s.,217,223,225 (citation). back
14 Moles: Théorie 1971, p.170,180. back
15 Cage defines his random procedures as not determined (Schulze: Spiel 2000, p.161-179), meanwhile the information aesthetics start out from stochastics (see chap. II.1.2): The probability to select an element via random procedure is already determined by the selection of the elements and their possible combinations. Florian Cramer demonstrates that Cage´s methods for chance operations don´t eliminate determinations (Cramer: Statements 2011, p.199-202). back
16 Götz: Malerei 1961, p.14 with fig.1, p.23 (citations).
Cf. Götz: Erinnerungen 1983, p.899s.,902; Klütsch: Computergrafik
2007, p.148; Mehring: Television Art 2008, p.36.
Further examples of "Statistic-Metric Modulations" in: Beckstette:
Bildstörung 2009; Götz: Erinnerungen 1983, p.869-905; Kersting:
Sammlung Etzold 1986, p.206 (with four examples being planned in summer
1959 and realised in February 1960).
Precursors of an aleatoric configuration of squares: Kelly, Ellsworth:
Spectrum Colors Arranged by Chance I-VIII, 1951, collages made with coloured
papers. In: Bois/Cowart/Pacquement: Kelly 1992, p.42ss.,168ss.,192. Morellet,
François: Repartitions aléatoires, since 1958, oil or acryl
on canvas. In: Holeczek/Mengden: Zufall 1992, p.23,46s.,278-281. back
17 Julesz: Dialoge 1997, p.137. back
18 Kovács: Julesz 2007. back
19 Julesz: Depth Perception 1960, p.1127,1134. back
20 Julesz: Depth Perception 1960, p.1134s.; Noll: Beginnings 1994, p.39. back
21 Julesz: Depth Perception 1960, p.1128 with fig.2, p.1154,1159. back
22 Julesz: Depth Perception 1960, p.1128 with fig.3, p.1156,1159. back
23 Julesz: Foundations 1971; Kovács: Julesz
1997; Weibel: Konturen 1997, p.40f.
In 1979 Christopher W. Tyler developed "Autostereograms". The
visual depth effect of the "Random Dot Stereograms" anticipates
the depth effect that "Autostereograms" provoke by a single
image (Tyler/Clarke: Autostereogram 1990). back
24 Julesz: Dialoge 1997, p.138. back
25 Noll: Beginnings 1994, p.39. back
26 Noll: Patterns 1962, p.4. back
27 Herzogenrath/Nierhoff-Wielk: Machina 2007, p.445 (citation); Klütsch: Computergrafik 2007, p.166s.; Noll: Human 1966, p.2. back
28 Noll: Patterns 1962, p.2s. back
29 Noll: Computers 1967, p.67. back
30 Davis: Art 1973, p.99; Herzogenrath/Nierhoff-Wielk:
Machina 2007, p.444ss., nr.356; Klütsch: Computergrafik 2007, p.167ss.;
Noll: Computers 1967, p.67; Piehler: Anfänge 2000, p.235f., unpaginated
with ill.46; Reichardt: Serendipity 1968, p.74; Rosen: Story 2008/2011,
p.249.
Noll was not inspired by information aesthetics (Klütsch: Computergrafk
2007, p.165s.). Nevertheless his works offer models for discussions of
the "aesthetic measure". back
31 Nake: Ästhetik 1974, p.199. back
32 Nees: Variationen 1964. Cf. Nees: Computergraphik 1969/2006, p.XIs., ill.4; Nees: Künstliche Kunst 2005, unpaginated with ill1s. back
33 Nees: Computergraphik 1969/2006, p.208. back
34 Nees: Computergraphik 1969/2006, p.208. back
35 Herzogenrath/Nierhoff-Wielk: Machina 2007, p.434s., nr. 309s.; 314, 317ss.; Nees: Computergrafik 2006, p.216ss. und 222ss. with ill.28-33, p.231 with ill.36, p.244 and p.247f. with ill.39-41. back
36 Nees: Computergraphik 1969/2006, p.27: "The perception dependency of the image nexus..." ("Die Perzeptionsabhängigkeit des Bildnexus..."). back
37 Nees: Computergraphik 1969/2006, p.29. Nees presents on page 24 a longer citation of Max Bense´s differentiation between "micro-aesthetics" ("orders [in the sense of orderliness] and complexity") and "macro-aesthetics" ("redundancy and information"), published in 1965 in part V of "Aesthetica" (New in: Bense: Aesthetica 1982, p.334. Cf. Klütsch: Computergrafik 2007, p.67-71). back
38 Nees: Computergraphik 1969/2006, p.209. back
39 Nees: Computergraphik 1969/2006, p.220. back
40 Nees: Computergraphik 1969/2006, p.213. Cf. p.177 with a further citation from Bense´s "Aesthetica" (part V of 1956. New in: Bense: Aesthetica 1982, p.142) on criteria to differentiate between "micro-" and "macro-aesthetics" (see ann.37). back
41 Nake, Frieder: Random Polygon Move, plotter drawing,
1963/64: Herzogenrath/Nierhoff-Wielk: Machina 2007, p.424, nr.259 (collection
Herbert W. Franke); Klütsch: Computergrafik 2007, p.131-139; Nake:
Ästhetik 1974, p.199s. with ill. 5.2-7. Nake presents an illustration
of the same "Random Polygon Move" that is a part of the collection
Franke (Kunsthalle Bremen), but with the date 1963 and the size 10 x 10
cm. Franke´s plotter drawing is combined with a history of its making:
It was realised in "6/7/64" with the program COMPART ER 56 and
the Zuse Graphomat Z64 (with the size 15,5 x 11,5 cm on a paper with the
size 21,1 x 15,1 cm). The program COMPART ER 56 was developed since 1964,
as it is noted by Nake: Ästhetik 1974, p.192 and Klütsch: Computergrafik
2007, p.132, but following Herzogenrath/Nierhoff-Wielk: Machina 2007,
p.236 it was developed since 1963.
Other early computer graphics: Electronic Associates Incorporated (EAI):
Stained Glass Window, 1963 (Herzogenrath/Nierhoff-Wielk: Machina 2007,
p.63,238 with ill.13, p.332, nr.66); Bäumer, Wolfgang: Untitled,
1963/64 (Herzogenrath/Nierhoff-Wielk: Machina 2007, p.94,309, nr.9s.);
Kawano, Hiroshi: Design 2-1 Markov Chain Pattern, 1964 (Rosen: Kawano
2011); Sumner, Lloyd: Eye´s Delight, 1964 (Dika: Computerkunst 2007,
p.75ss., ill.32). back
42 Nake: Ästhetik 1974, p.229. back
43 Nake: Ästhetik 1974, p.232. back
44 Nake: Ästhetik 1974, p.229. back
45 Nake: Ästhetik 1974, p.235. back
46 Herzogenrath/Nierhoff-Wielk: Machina 2007, p.426, nr.267; Klütsch: Computergrafik 2007, p.152ss.; Nake: Ästhetik 1974, p.236s. with ill.5.5-5; Rödiger: Algorithmik 2003, p.98,134,141,164. back
47 Herzogenrath/Nierhoff-Wielk: Machina 2007, p.426f., nr.268,271,273; Nake: Ästhetik 1974, p.237s. with ill. 5.5-6. back
48 Nake: Ästhetik 1974, p.241; Nees: Computergrafik 1969/2006, p.208s. back
49 Nake: Ästhetik 1974, p.236,262. back
50 Nake: Ästhetik 1974, p.263. In 1970 Nake presented "Generative Aesthetics I" for the first time at the symposium "Computer Graphics 70" in Uxbridge (Nake: Generative Aesthetics 1970). back
51 Nake: Ästhetik 1974, p.264-271. back
52 Nake: Ästhetik 1974, p.273-276 with ill.5.8-7, 5.8-8 (with examples of 1969 for notations and realisations with coloured little sheets). The preselectors "have been implemented in PL/I at the university of Toronto in 1969 on an IBM 360-65 since November 1965] " (ibid., S.273). Nake: Brief 1973, p.225: "Only two examples were realised by hand, because I wanted to produce works in seizes greater than the seizes that were realisable with plotter drawings." Cf. Klütsch: Computergrafik 2007, p.155-158 with ill.33ss. back
53 Nake: Ästhetik 1974, p.277. back
54 Bense: Aesthetica 1982, p.333-338. back
55 Nake: Ästhetik 1974, p.277. back
56 Galanter: Generative Art 2003 refering to Moles: Théorie 1958. back